


Bitcoin Price Dumped To $66K As Bears Gain Strength, $64K Next?
Bitcoin price started another decline from the $70,000 resistance zone. BTC is down over 5% and there was a move below the $67,500 support. Bitcoin price is gaining bearish momentum from the $70,000 resistance zone. The price is trading below $68,500 and the 100 hourly Simple moving average. There is a key bearish trend line forming with resistance near $68,400 on the hourly chart of the BTC/USD pair (data feed from Kraken). The pair could extend its decline toward the $64,000 support zone in the near term. Bitcoin Price Turns Red Bitcoin price struggled to settle above the $70,000 resistance zone. BTC reacted to the downside after it broke the $69,200 support zone. There was a sharp move below the $68,500 level. The price even declined below the $67,000 level. Finally, it tested the $66,000 with a bearish angle. A low was formed near $65,992 and the price is now attempting a recovery wave. There was a move above the $66,800 level. The price moved above the 23.6% Fib retracement level of the downward move from the $69,884 swing high to the $65,992 low. However, Bitcoin is now trading below $68,500 and the 100 hourly Simple moving average. There is also a key bearish trend line forming with resistance near $68,400 on the hourly chart of the BTC/USD. Immediate resistance is near the $68,000 level. It is close to the 50% Fib retracement level of the downward move from the $69,884 swing high to the $65,992 low. The first major resistance could be $68,500 and the trend line. If there is a clear move above the $68,500 resistance zone, the price could start a fresh increase. Source: BTCUSD on TradingView.com In the stated case, the price could rise toward the $70,000 resistance zone in the near term. The next major resistance is near the $71,500 zone. More Losses In BTC? If Bitcoin fails to rise above the $68,000 resistance zone, it could continue to move down. Immediate support on the downside is near the $66,000 level. The first major support is $65,000. The next support sits at $64,000. If there is a close below $64,000, the price could start a drop toward the $62,500 level. Any more losses might send the price toward the $60,500 support zone in the near term. Technical indicators: Hourly MACD – The MACD is now gaining pace in the bearish zone. Hourly RSI (Relative Strength Index) – The RSI for BTC/USD is now below the 50 level. Major Support Levels – $66,000, followed by $65,000. Major Resistance Levels – $68,000, $68,500, and $70,000.

Bitcoin price started another decline from the $70,000 resistance zone. BTC is down over 5% and there was a move below the $67,500 support.
- Bitcoin price is gaining bearish momentum from the $70,000 resistance zone.
- The price is trading below $68,500 and the 100 hourly Simple moving average.
- There is a key bearish trend line forming with resistance near $68,400 on the hourly chart of the BTC/USD pair (data feed from Kraken).
- The pair could extend its decline toward the $64,000 support zone in the near term.
Bitcoin Price Turns Red
Bitcoin price struggled to settle above the $70,000 resistance zone. BTC reacted to the downside after it broke the $69,200 support zone. There was a sharp move below the $68,500 level.
The price even declined below the $67,000 level. Finally, it tested the $66,000 with a bearish angle. A low was formed near $65,992 and the price is now attempting a recovery wave. There was a move above the $66,800 level.
The price moved above the 23.6% Fib retracement level of the downward move from the $69,884 swing high to the $65,992 low. However, Bitcoin is now trading below $68,500 and the 100 hourly Simple moving average. There is also a key bearish trend line forming with resistance near $68,400 on the hourly chart of the BTC/USD.
Immediate resistance is near the $68,000 level. It is close to the 50% Fib retracement level of the downward move from the $69,884 swing high to the $65,992 low. The first major resistance could be $68,500 and the trend line. If there is a clear move above the $68,500 resistance zone, the price could start a fresh increase.
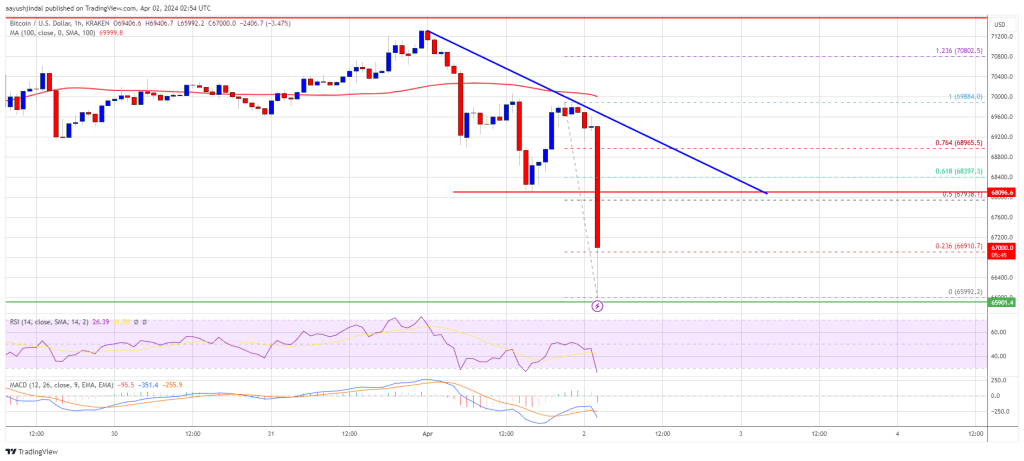
Source: BTCUSD on TradingView.com
In the stated case, the price could rise toward the $70,000 resistance zone in the near term. The next major resistance is near the $71,500 zone.
More Losses In BTC?
If Bitcoin fails to rise above the $68,000 resistance zone, it could continue to move down. Immediate support on the downside is near the $66,000 level.
The first major support is $65,000. The next support sits at $64,000. If there is a close below $64,000, the price could start a drop toward the $62,500 level. Any more losses might send the price toward the $60,500 support zone in the near term.
Technical indicators:
Hourly MACD – The MACD is now gaining pace in the bearish zone.
Hourly RSI (Relative Strength Index) – The RSI for BTC/USD is now below the 50 level.
Major Support Levels – $66,000, followed by $65,000.
Major Resistance Levels – $68,000, $68,500, and $70,000.
What's Your Reaction?