


Bearish Stick Sandwich Pattern – Psychology And Trading Ideas
Bearish Stick Sandwich Pattern: Technical analysts heavily rely on chart and candlestick patterns to conduct a thorough analysis of stock prices and accurately predict their future movements. Each pattern formed in the market has a clear and justified reason behind its formation and provides a strong indication of the market’s direction. Several crucial patterns have […] The post Bearish Stick Sandwich Pattern – Psychology And Trading Ideas appeared first on Trade Brains.


Bearish Stick Sandwich Pattern: Technical analysts heavily rely on chart and candlestick patterns to conduct a thorough analysis of stock prices and accurately predict their future movements. Each pattern formed in the market has a clear and justified reason behind its formation and provides a strong indication of the market’s direction.
Several crucial patterns have led to significant price movements after their formation, making them integral to the analysis process. In this article, we will learn about one such pattern called the bearish stick sandwich pattern.
What is a Bearish Stick Sandwich Pattern?
A Bearish stick sandwich pattern is a three-candlestick pattern that indicates a potential reversal. In this pattern, the centre candle is oppositely colored to the two candles on either side of it.
A bearish stick sandwich pattern is a bearish reversal pattern where the middle candle is a red candle and the other two candles are green candles. It is also necessary for the first and the last candles in this pattern to have their close prices near the same levels.
Furthermore, the third candle in this pattern must engulf the middle red candle. It is preferable for this pattern to appear in an uptrend as the accuracy of the indication increases in that situation.

Bearish Stick Sandwich Pattern – Formation
Three conditions need to be met for a three-candlestick pattern to be called a bearish stick sandwich pattern:
Condition 1- The prior trend before the formation of this pattern must be an uptrend.
Condition 2- The middle candle needs to be bearish (red candle) while the other two candles need to be bullish candle (green candle).
Condition 3- The third candle must engulf the middle candle and also must close near the same price as the first candle’s close price.
Also read…
Bearish Stick Sandwich Pattern – Psychology
In a bullish market, buyers are in control of the market and hence the first candle is green. The formation of the second red candle indicates a weakness in buying pressure and this can potentially indicate the sellers to enter the market.
But when the third candle (green candle) closes near the same price as the first candle, it indicates a resistance at that price. Hence there is a higher possibility that the price might take a rejection and come down.
Bearish Stick Sandwich Pattern – Trading Ideas
It is necessary for the prior trend before the formation of this pattern to be an uptrend. Once formed in an uptrend, traders can take a trade as follows:
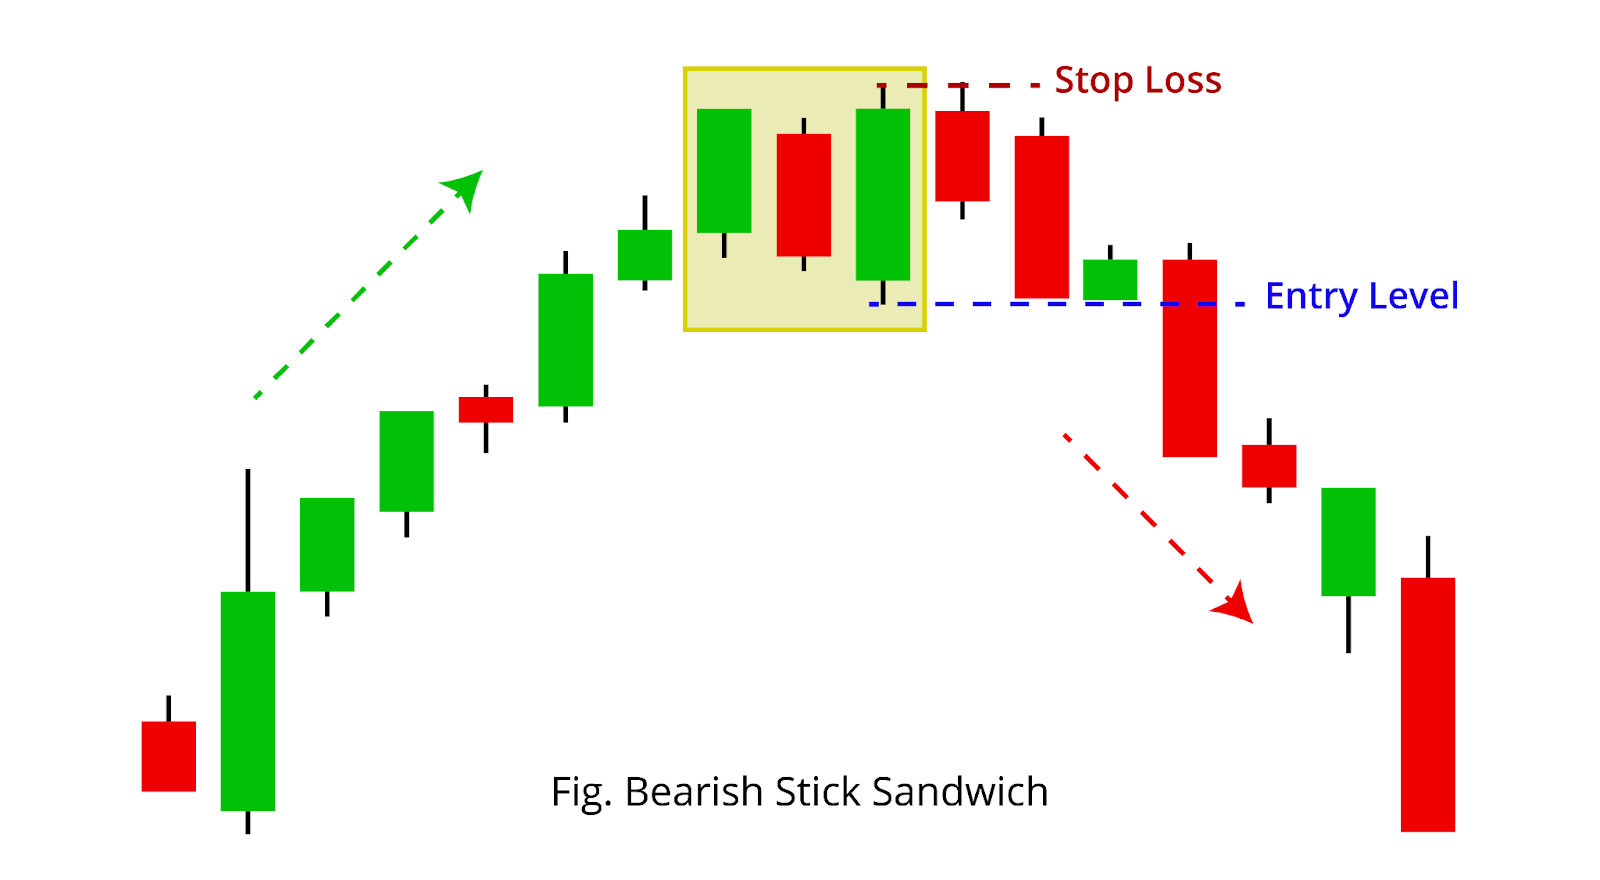
- Entry- Traders can take a short position once the price of the security goes below the open price of the last candle of the pattern.
- Target- Traders can exit the trade once the price reaches the immediate support zone. Once this level is reached, you can also book partial profits in the trade and hold on to the remaining position until the next support level.
- Stop loss- Traders should place the stop loss right above the high price of the pattern.
Does Bearish Stick Sandwich always indicate the Bearish movement?
The bearish stick sandwich pattern is not one of the frequently appearing candlestick patterns. There is a possibility that the trader can misinterpret this pattern as a bullish engulfing which indicates an upward movement of the price.
Thus, during the formation of the pattern, one should interpret the two green candles formed as a resistance zone since the price failed to break above these levels. Furthermore, one should note that this pattern does not indicate a complete trend reversal but rather indicates just a short downward movement.
Bearish Stick Sandwich Pattern – Example

In the above 15-minute chart of NIFTY BANK, we can observe the formation of the bearish stick sandwich pattern. We can observe that it appeared after an uptrend and after its formation, the price went down.
We can also see that the close of the first and last candles is almost the same and the last candle also engulfs the middle candle. At the time when this pattern was formed, traders could’ve taken a sell entry at Rs.44629.20 and the stop loss was at Rs. 44670.20
Bearish Stick Sandwich Pattern – Key Characteristics
- The bearish stick sandwich pattern is formed in an uptrend.
- It consists of three candles with the middle candle being a red candle and the other two being a green candle.
- The close prices of the first and the last candles are near the same price.
- The third candle engulfs the middle red candle.
- The formation of this pattern indicates a weakness in the buying pressure.
- The close price of the first and last candles acts as a resistance zone where the price might see a rejection.
Read more: Hanging Man Candlestick Pattern
Conclusion
In this article, we discussed the bearish stick sandwich pattern which is a short-term bearish movement indication pattern. We understood how to identify the pattern, the reason behind it, how to take a trade based on it, and the precautions that need to be taken while analyzing and taking trades.
Traders should not be taking a trade just based on this pattern but must also use other indicators before taking a trade. It is necessary to place a stop loss as it will minimize the losses in cases where the market moves against our analysis. What are your views about this pattern, please let us know in the comment section.
Written by Praneeth Kadagi
By utilizing the stock screener, stock heatmap, portfolio backtesting, and stock compare tool on the Trade Brains portal, investors gain access to comprehensive tools that enable them to identify the best stocks, also get updated with stock market news, and make well-informed investments.
The post Bearish Stick Sandwich Pattern – Psychology And Trading Ideas appeared first on Trade Brains.
What's Your Reaction?